Operative Intelligence – Enterprise Ready Conversation Intelligence

good-design-award_gold-winner_rgb_blk_logo

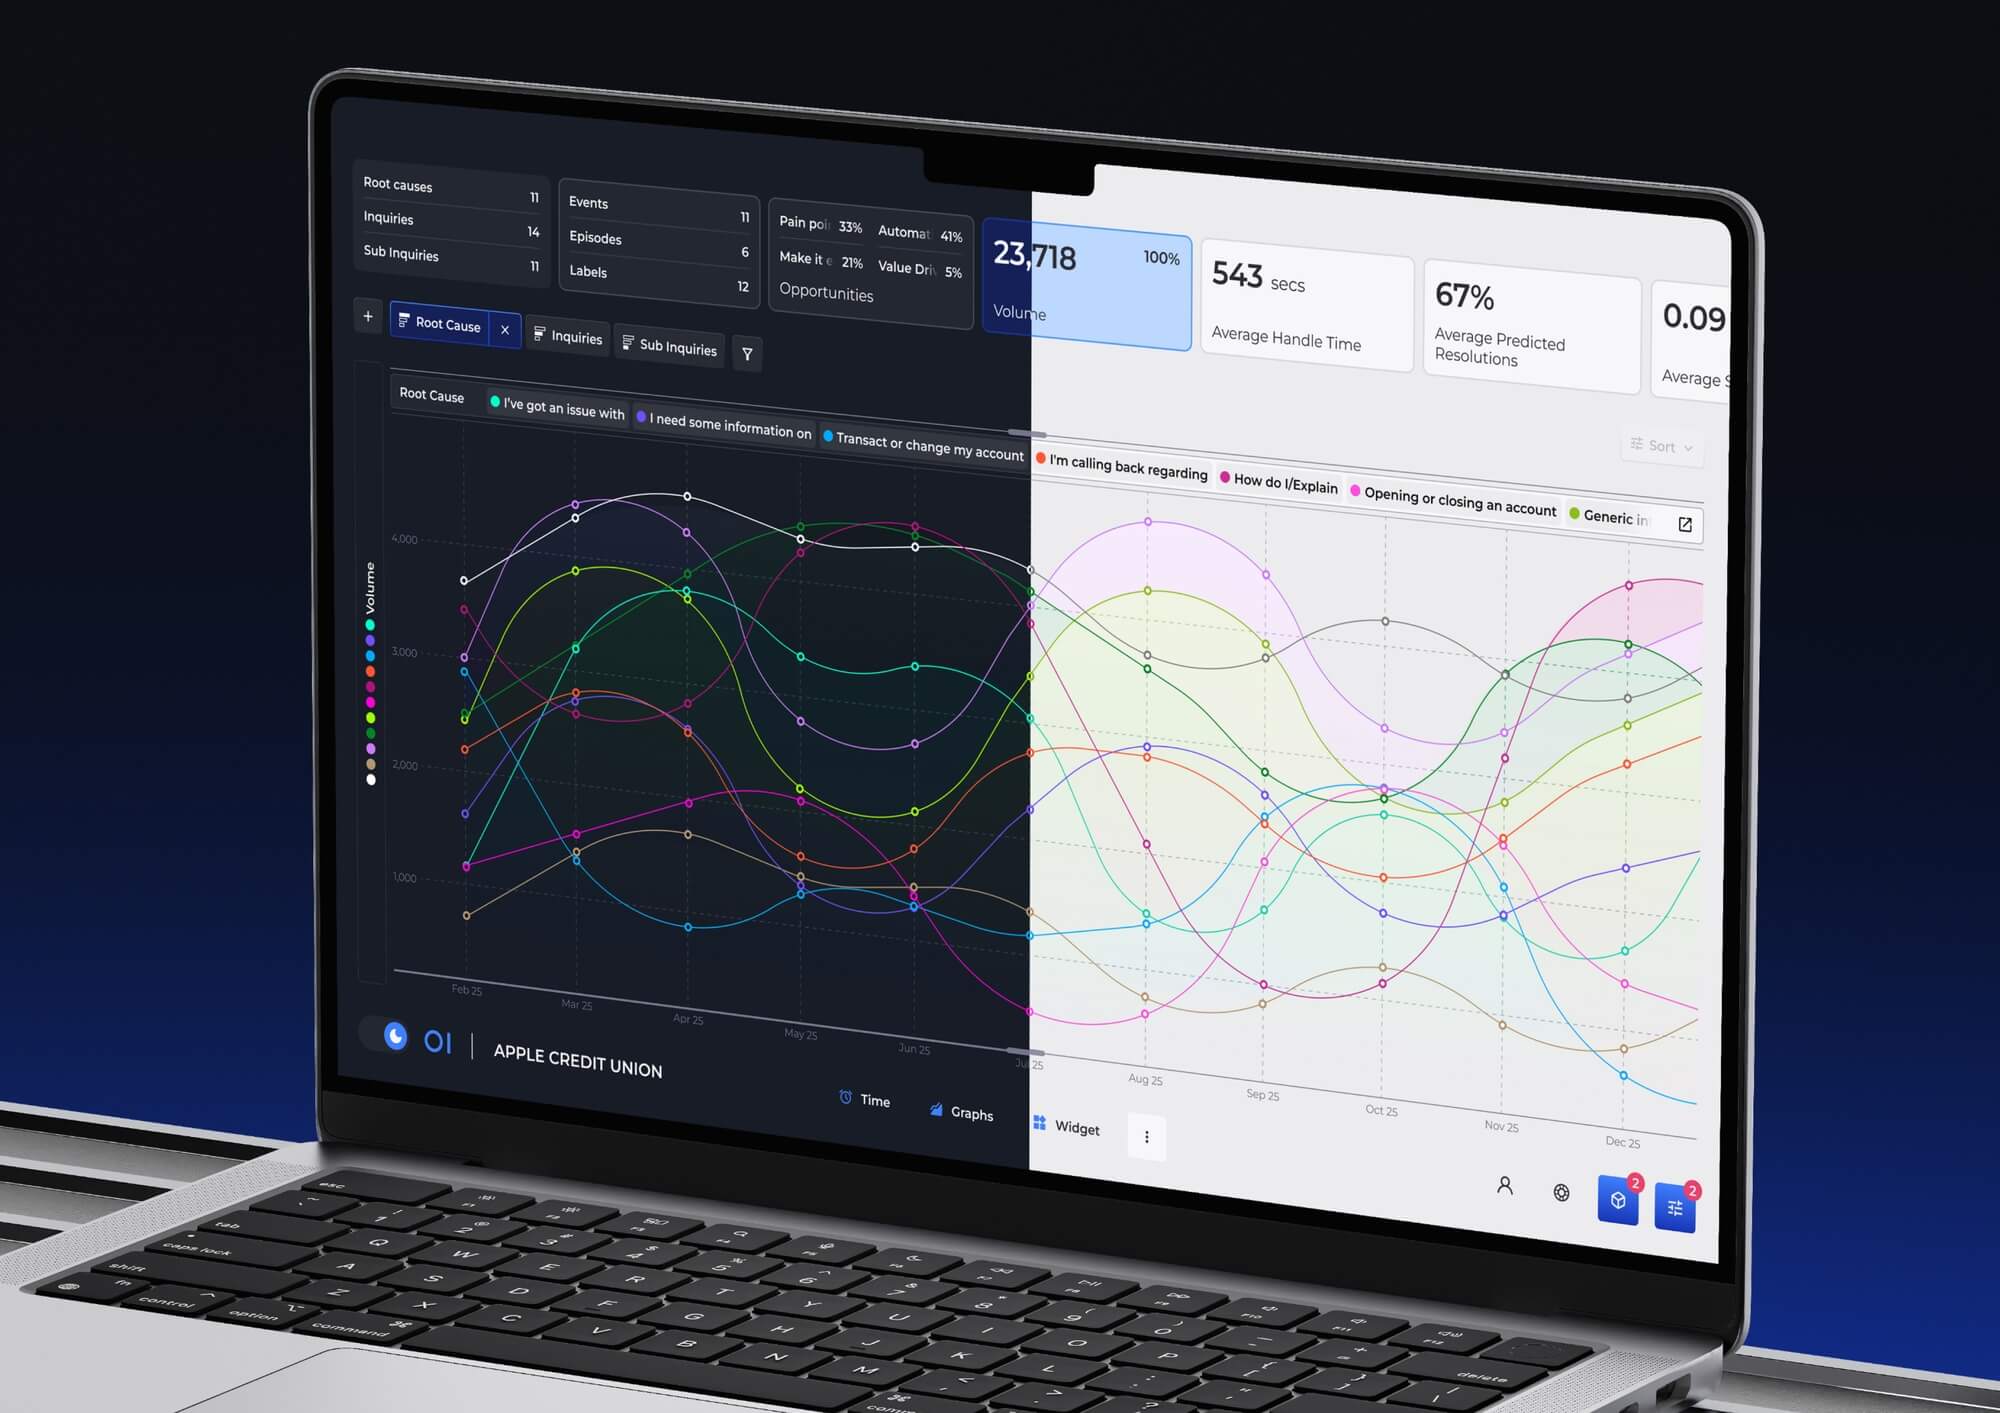
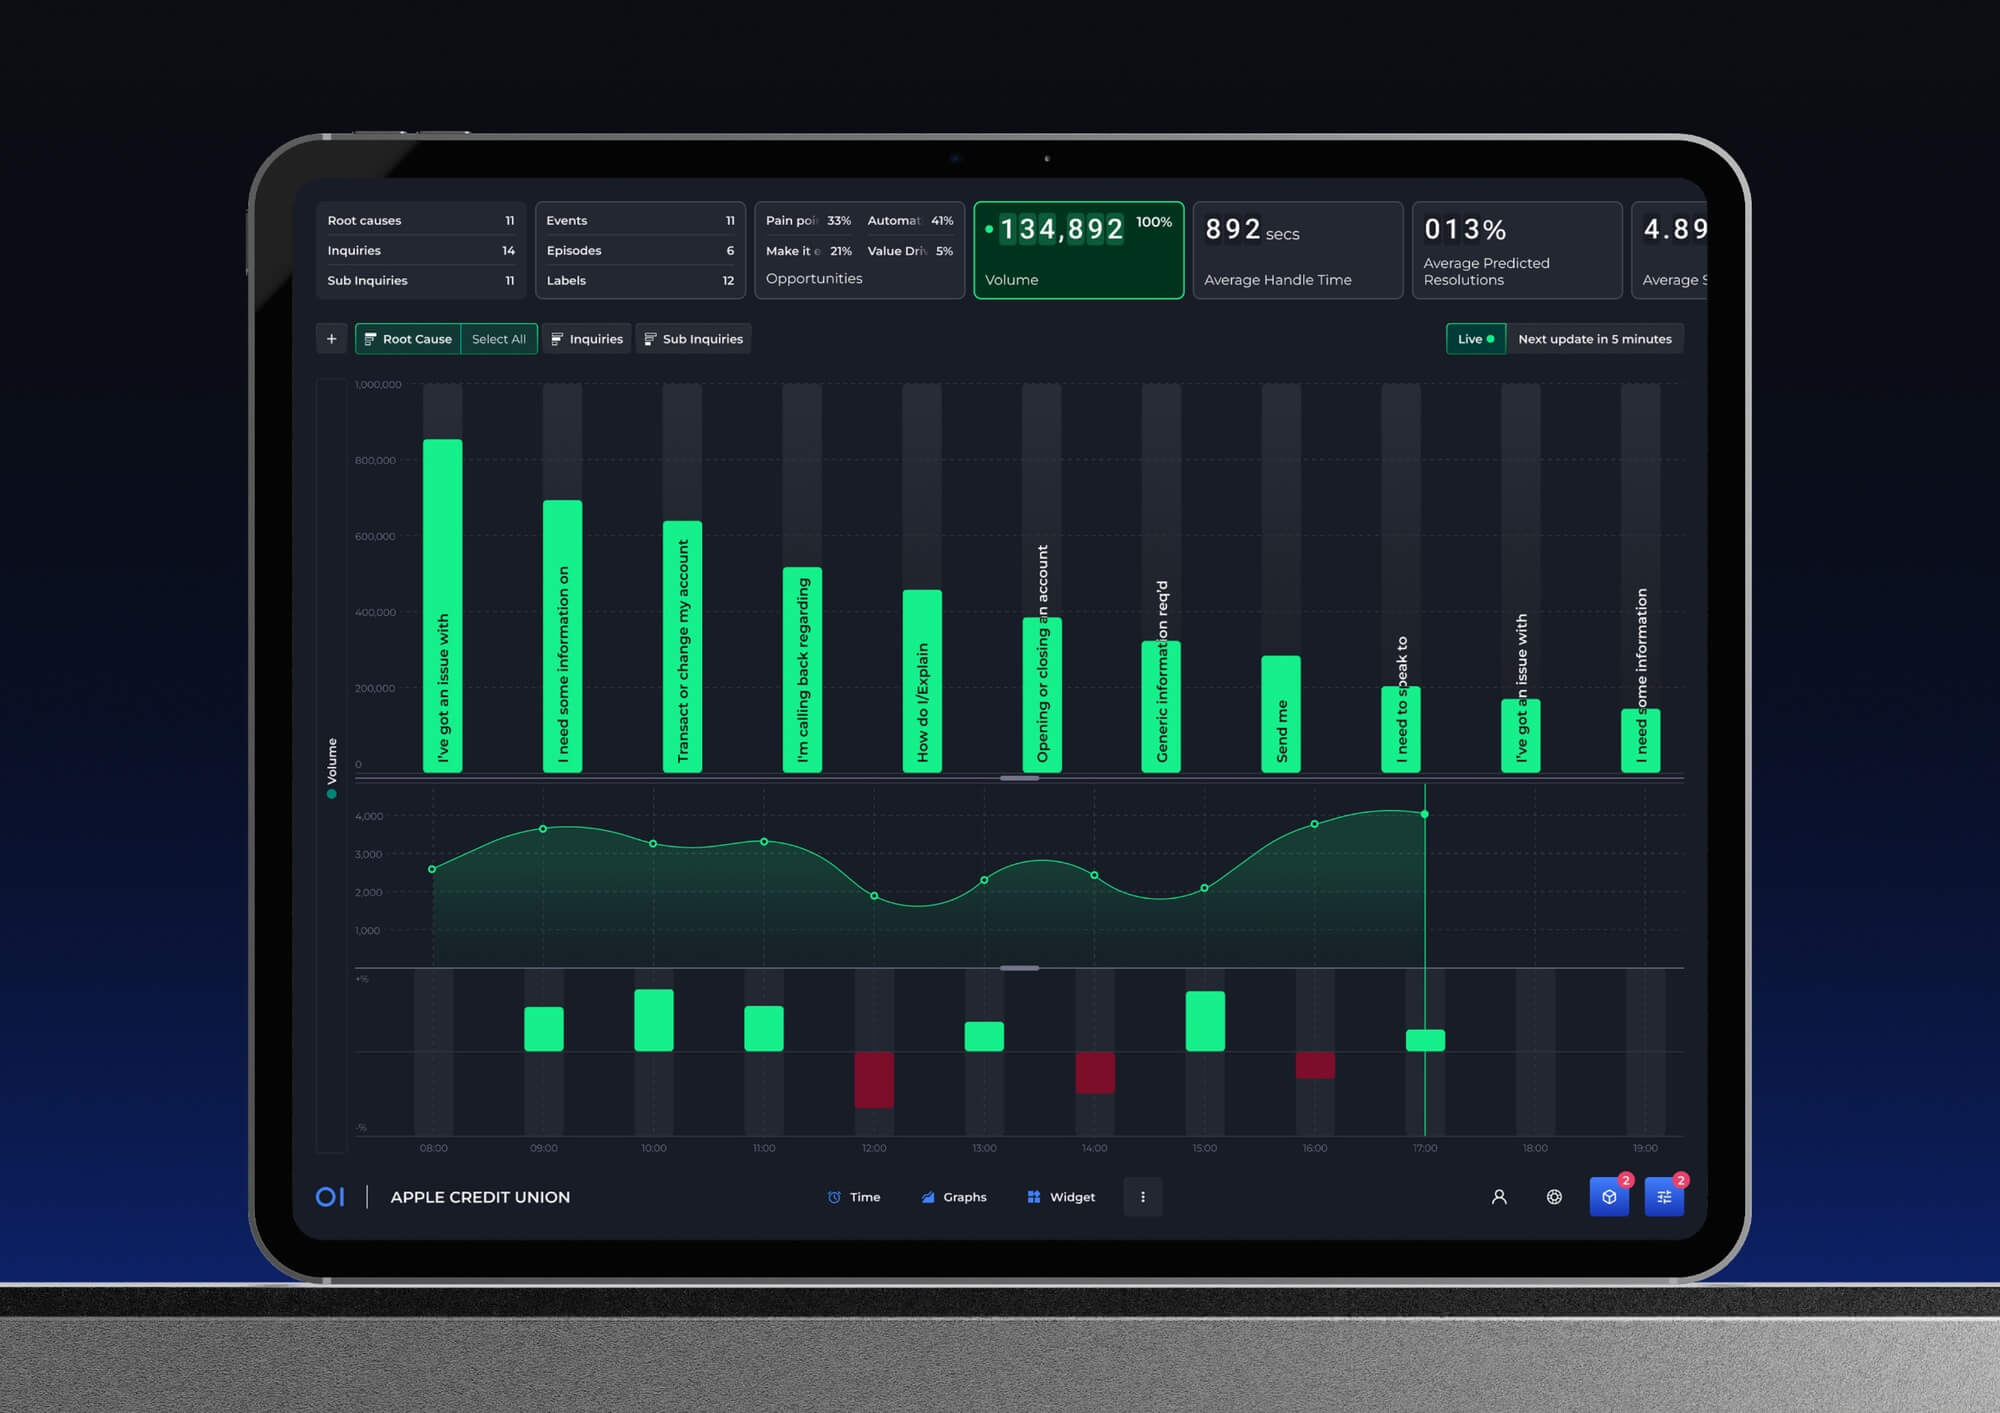
Operative Intelligence (OI) is an enterprise-grade conversation intelligence platform purpose-built for contact centres. The team designed a comprehensive UI/UX product system that transforms millions of raw customer conversations into precise, actionable insights — delivering root cause analysis, QA automation, agent coaching, and cost analytics through a powerful, no-code analytics interface.
view website
Buy online

2.jpg
Mo Works
3.jpg
Mo Works
4.jpg
Mo Works
5.jpg
Mo Works
6.jpg
Mo Works
7.jpg
Mo Works
8.jpg
Mo Works
9.jpg
Mo Works
  • CHALLENGE
  • SOLUTION
  • IMPACT
  • MORE
  • Contact centres sit on mountains of conversation data but lack the tools to understand it. OI’s founders experienced this firsthand, manually analysing 5,000+ verbatim customer requests to uncover the truth behind contact drivers. The design challenge was to translate that level of analytical depth into a product interface anyone could use confidently. Millions of data points across dozens of dimensions needed to remain legible in a single view, while enabling users to explore cause and effect in real time: click a dimension, watch the data respond, form a hypothesis, test it, and act on what they learn.

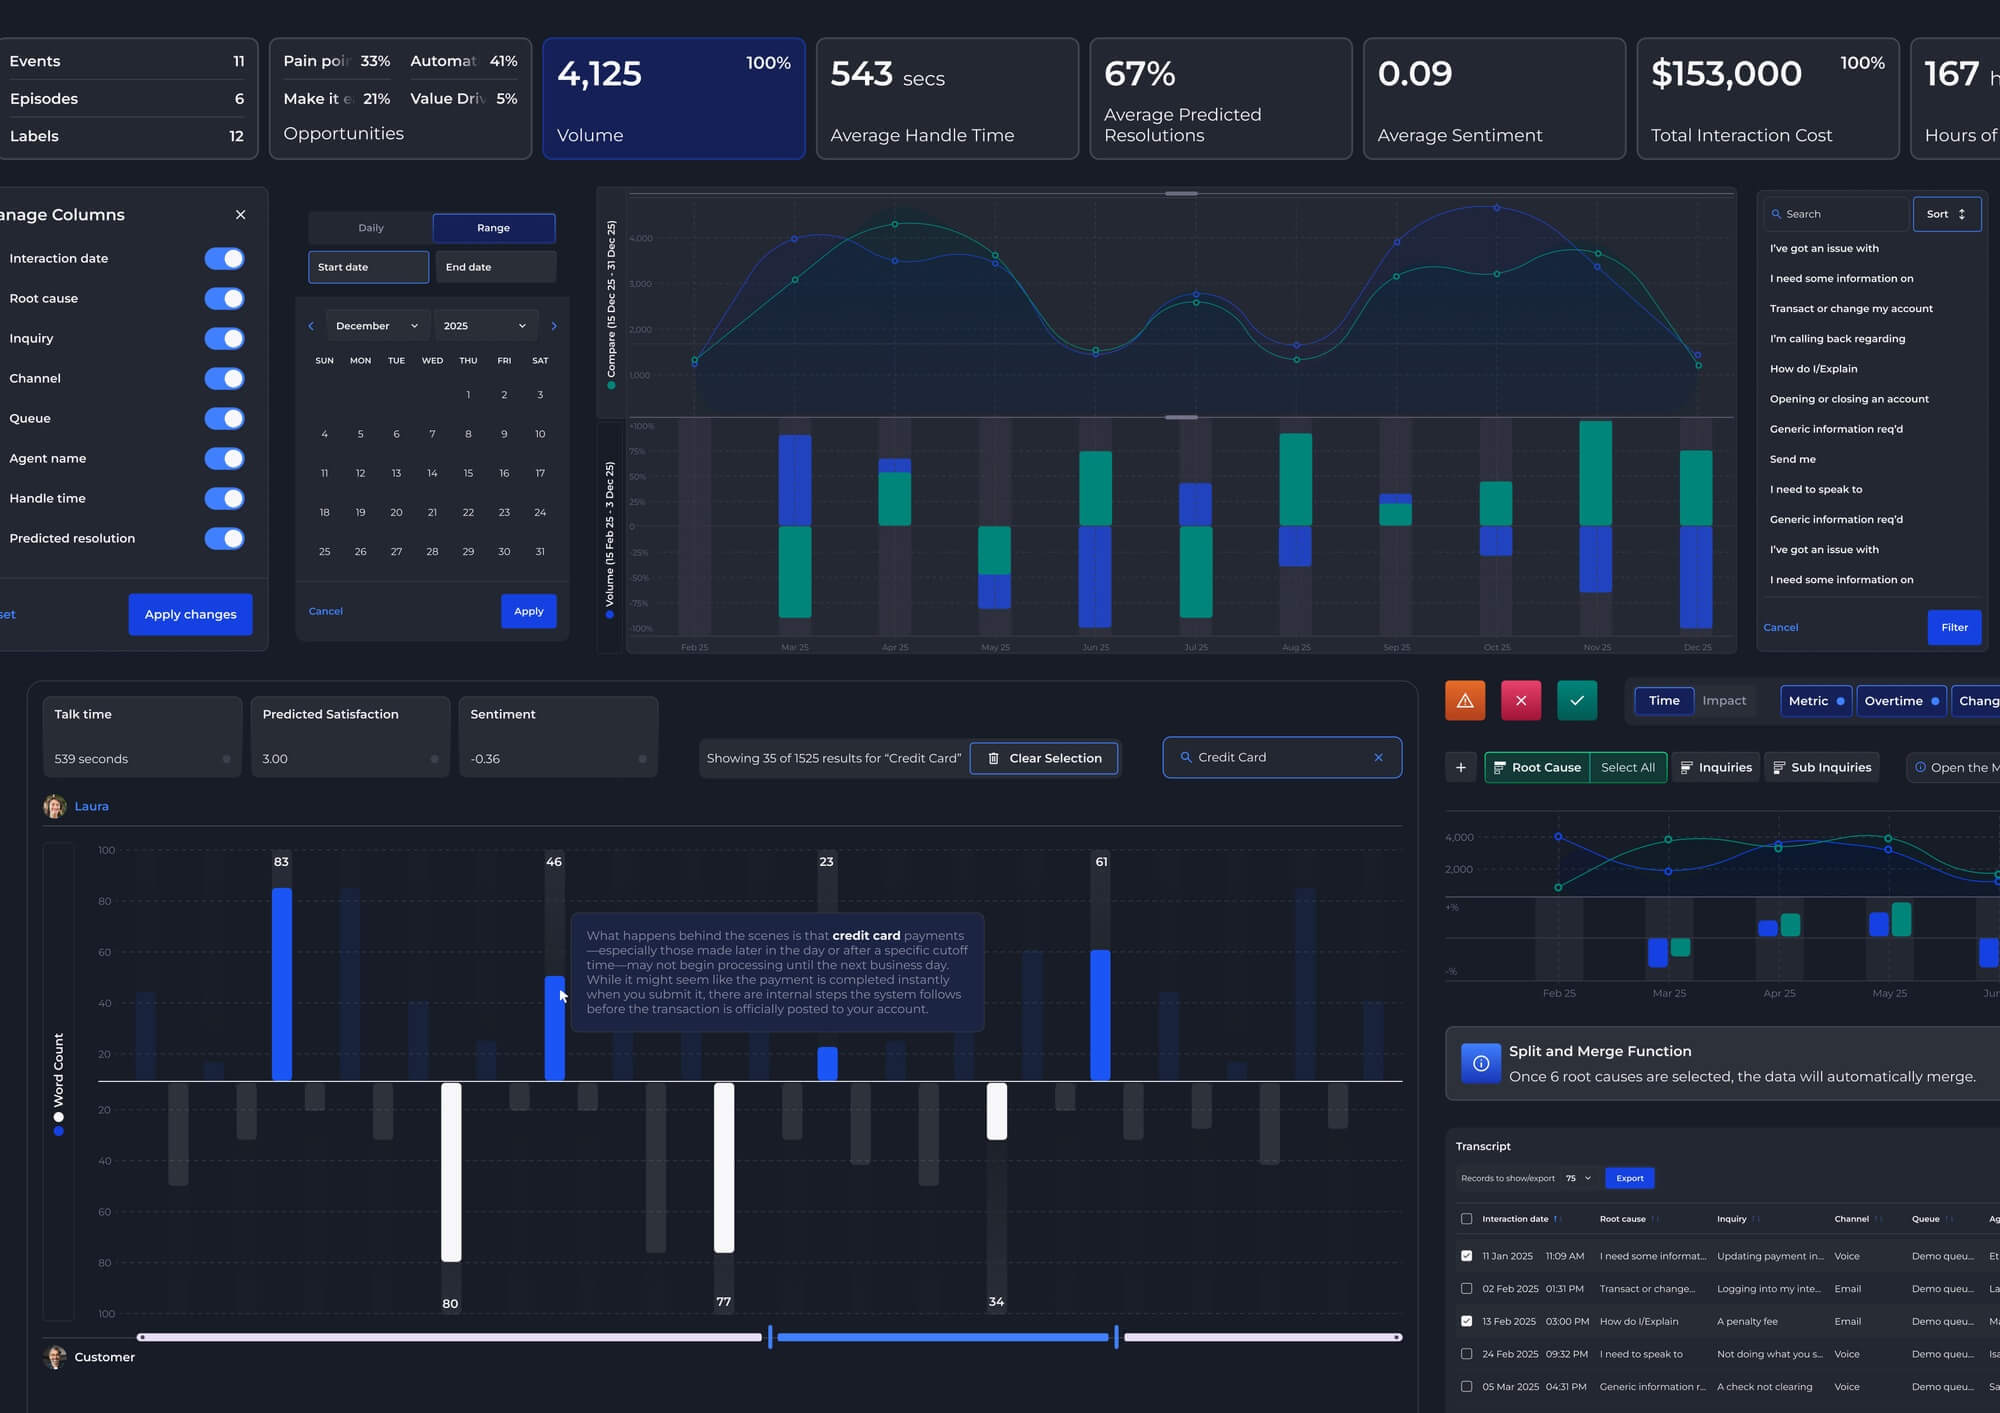
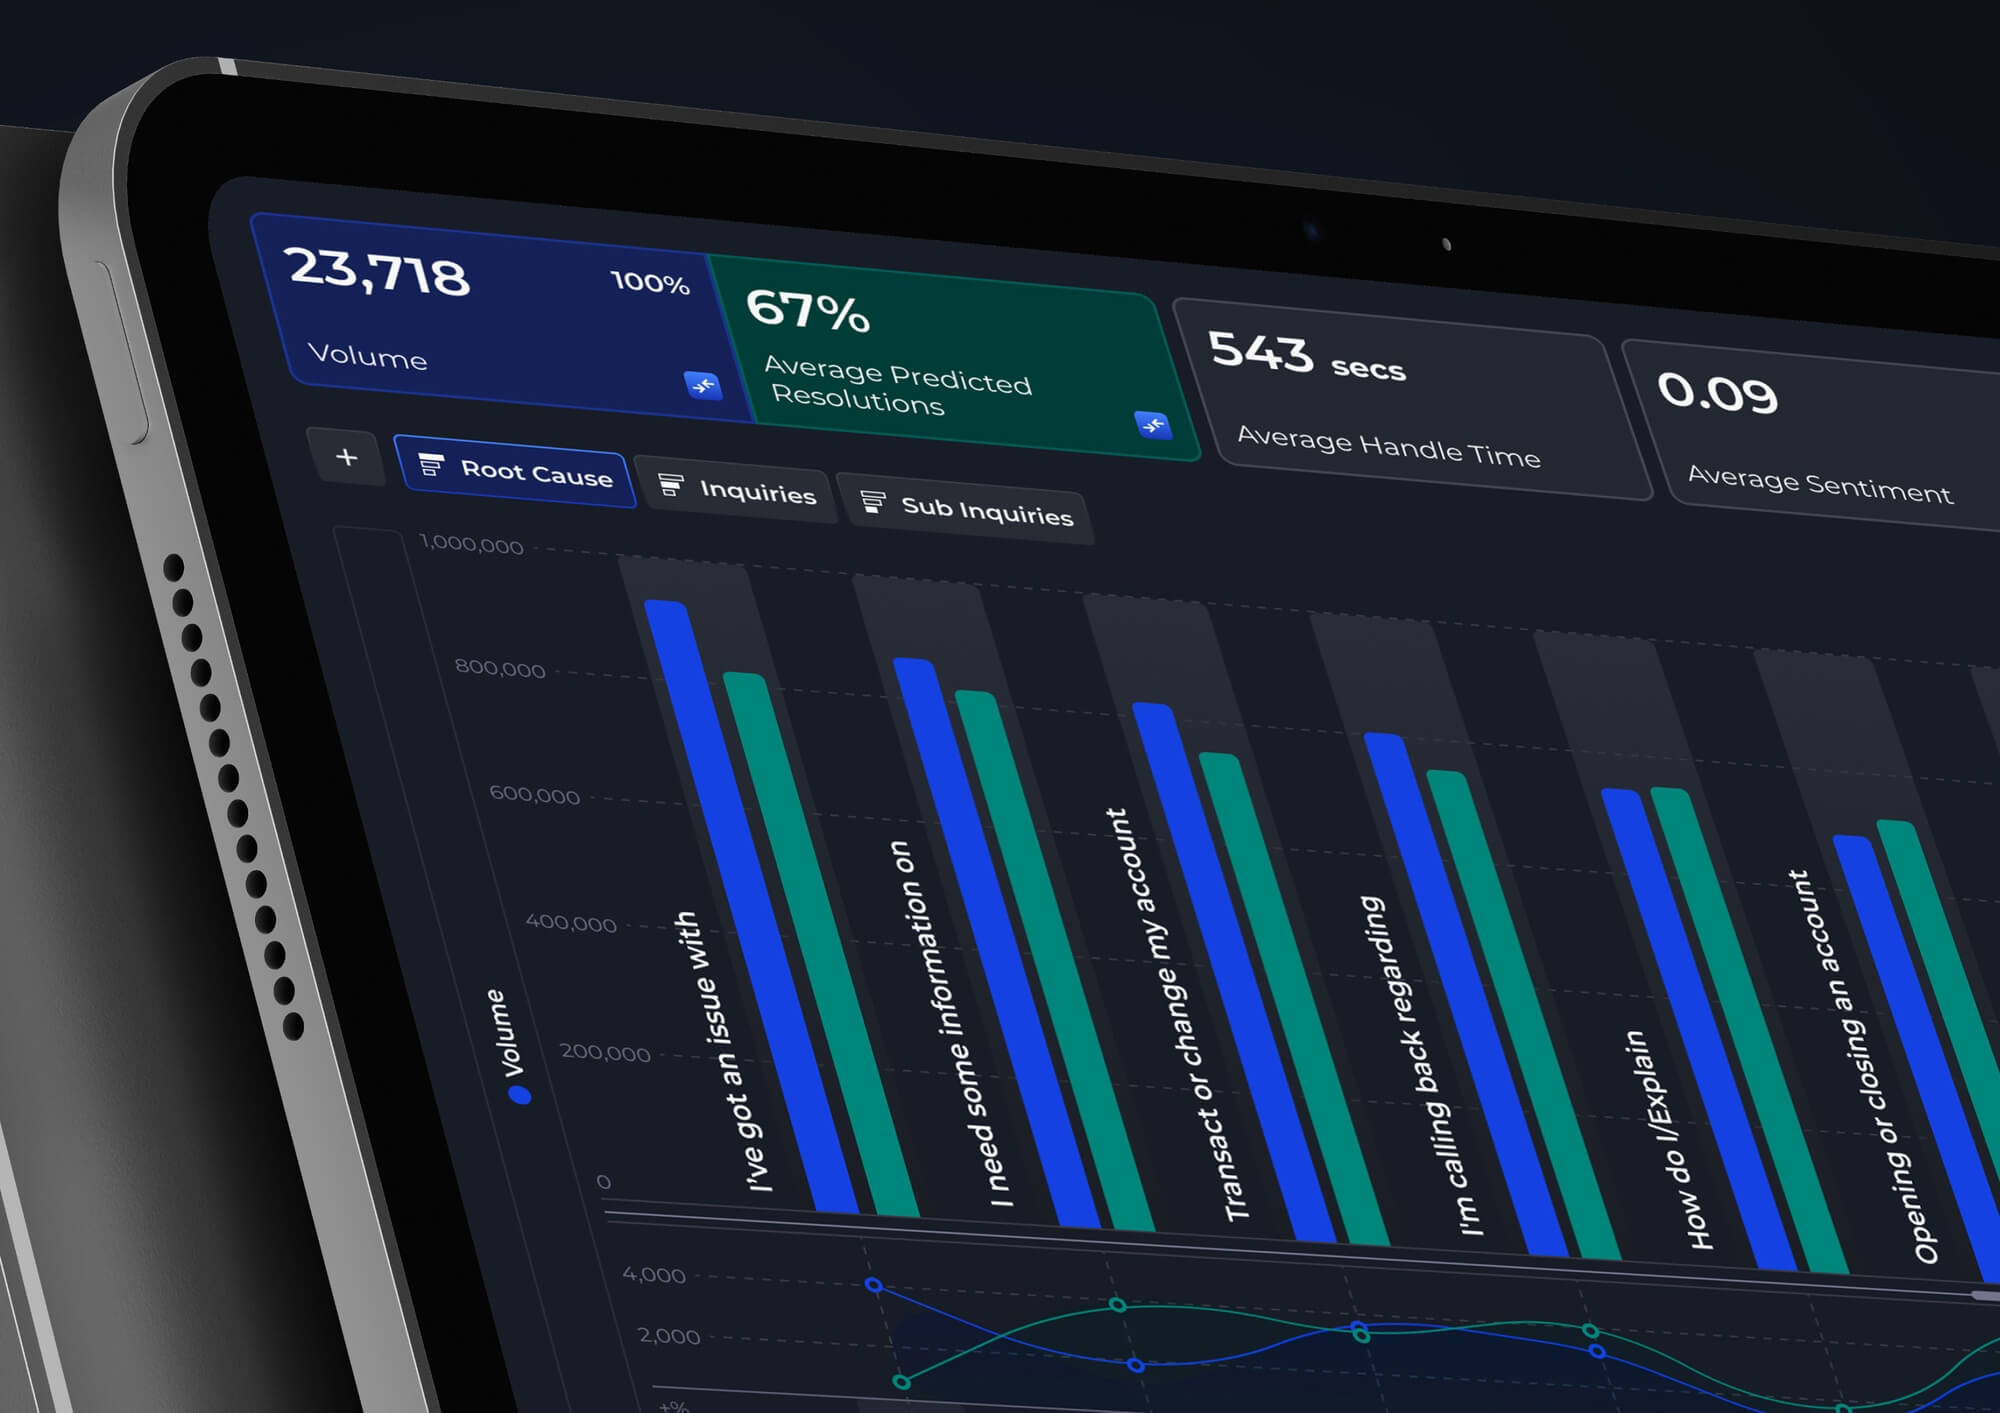
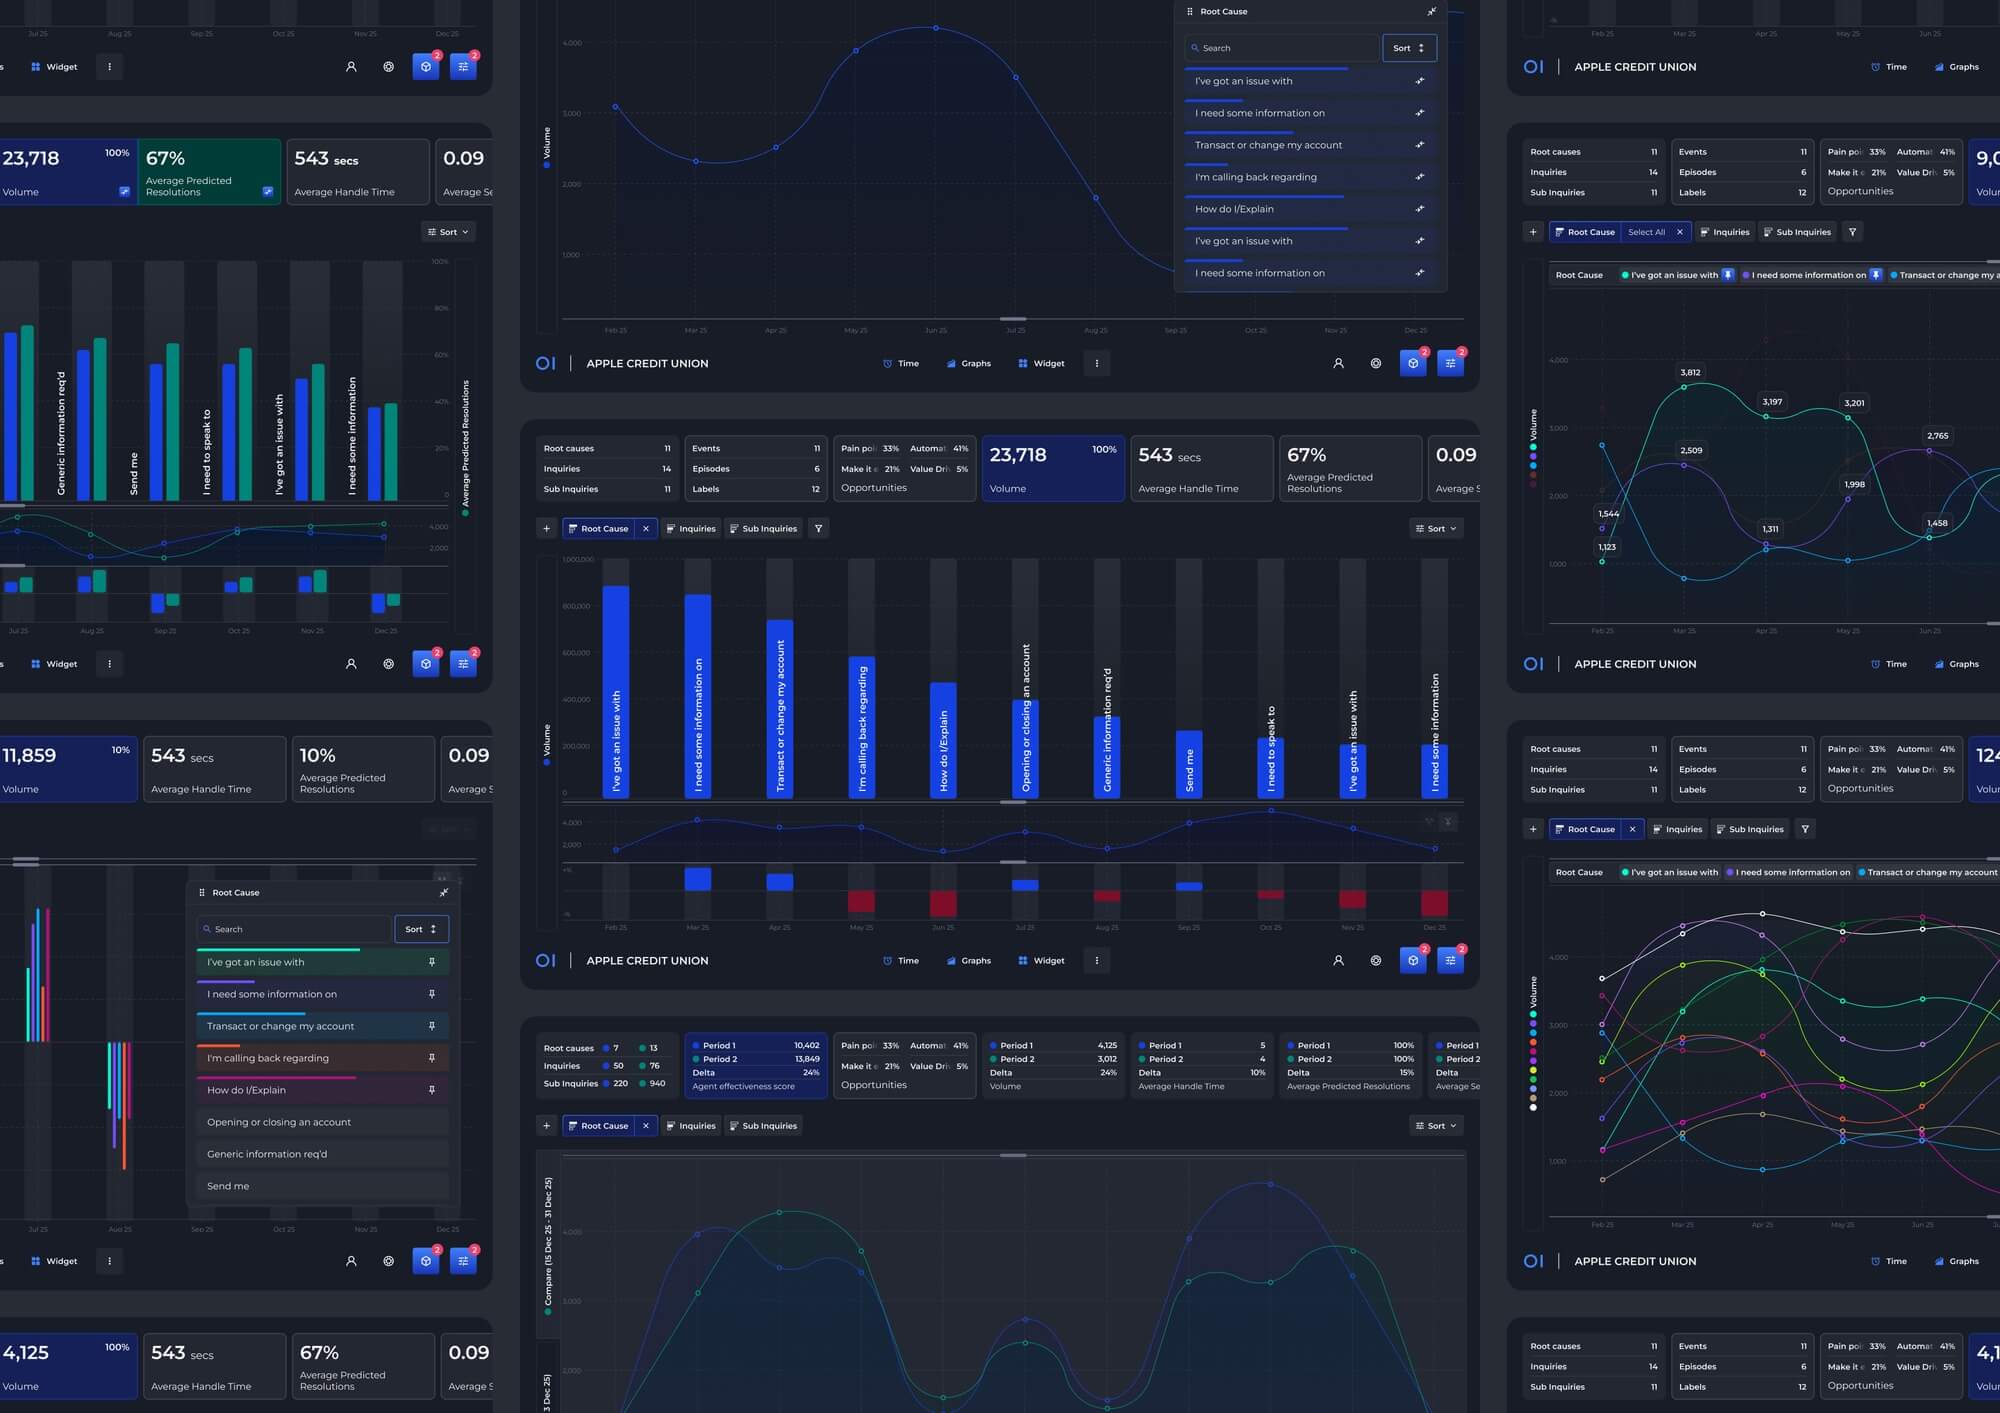
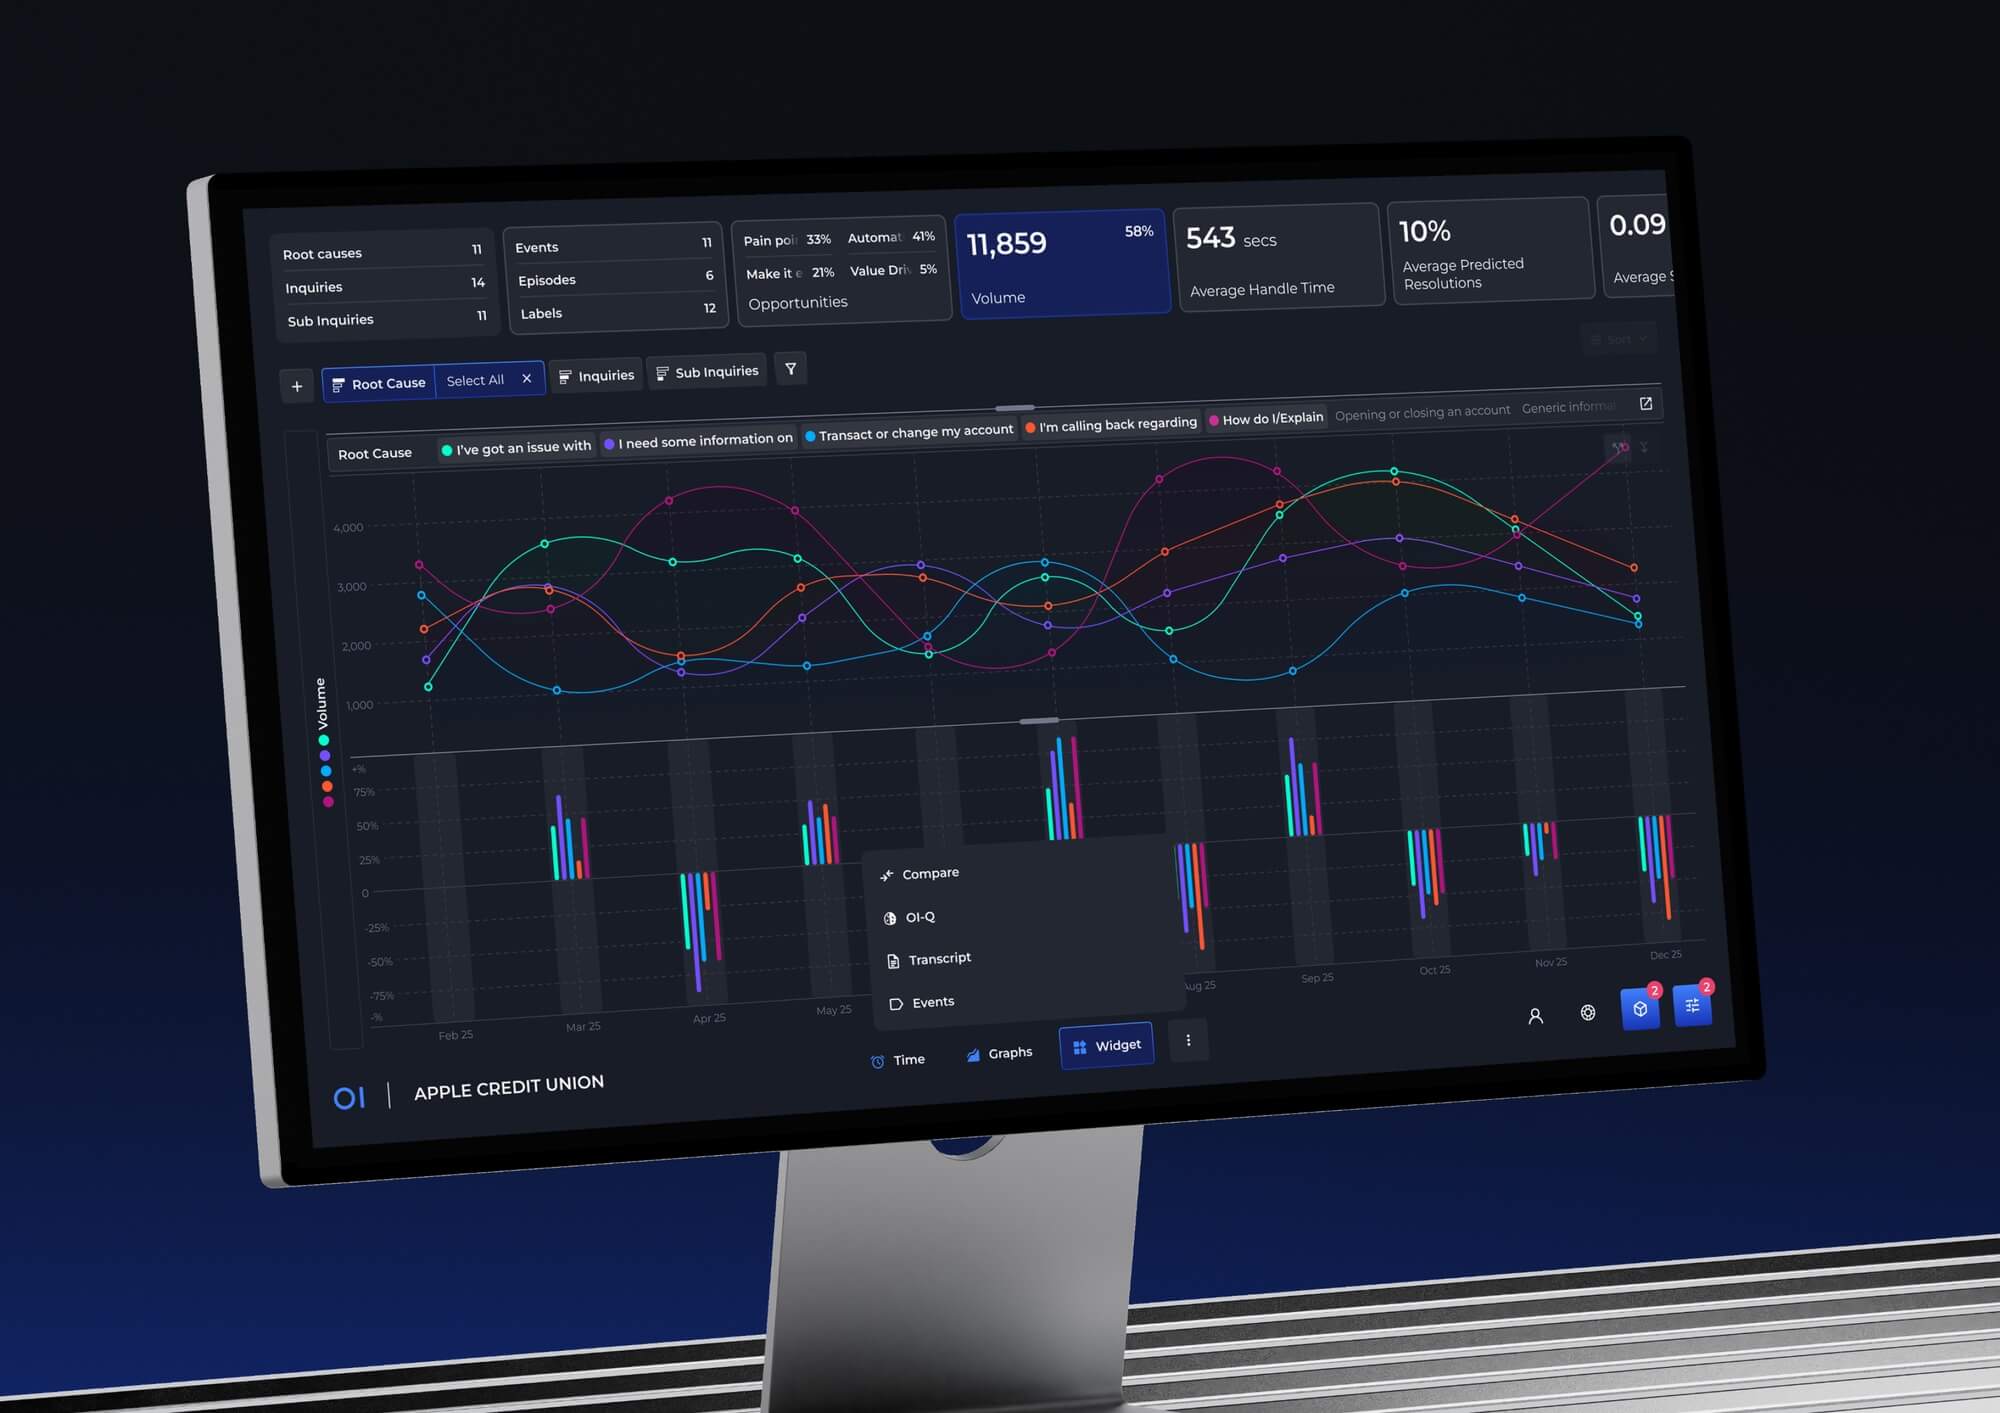
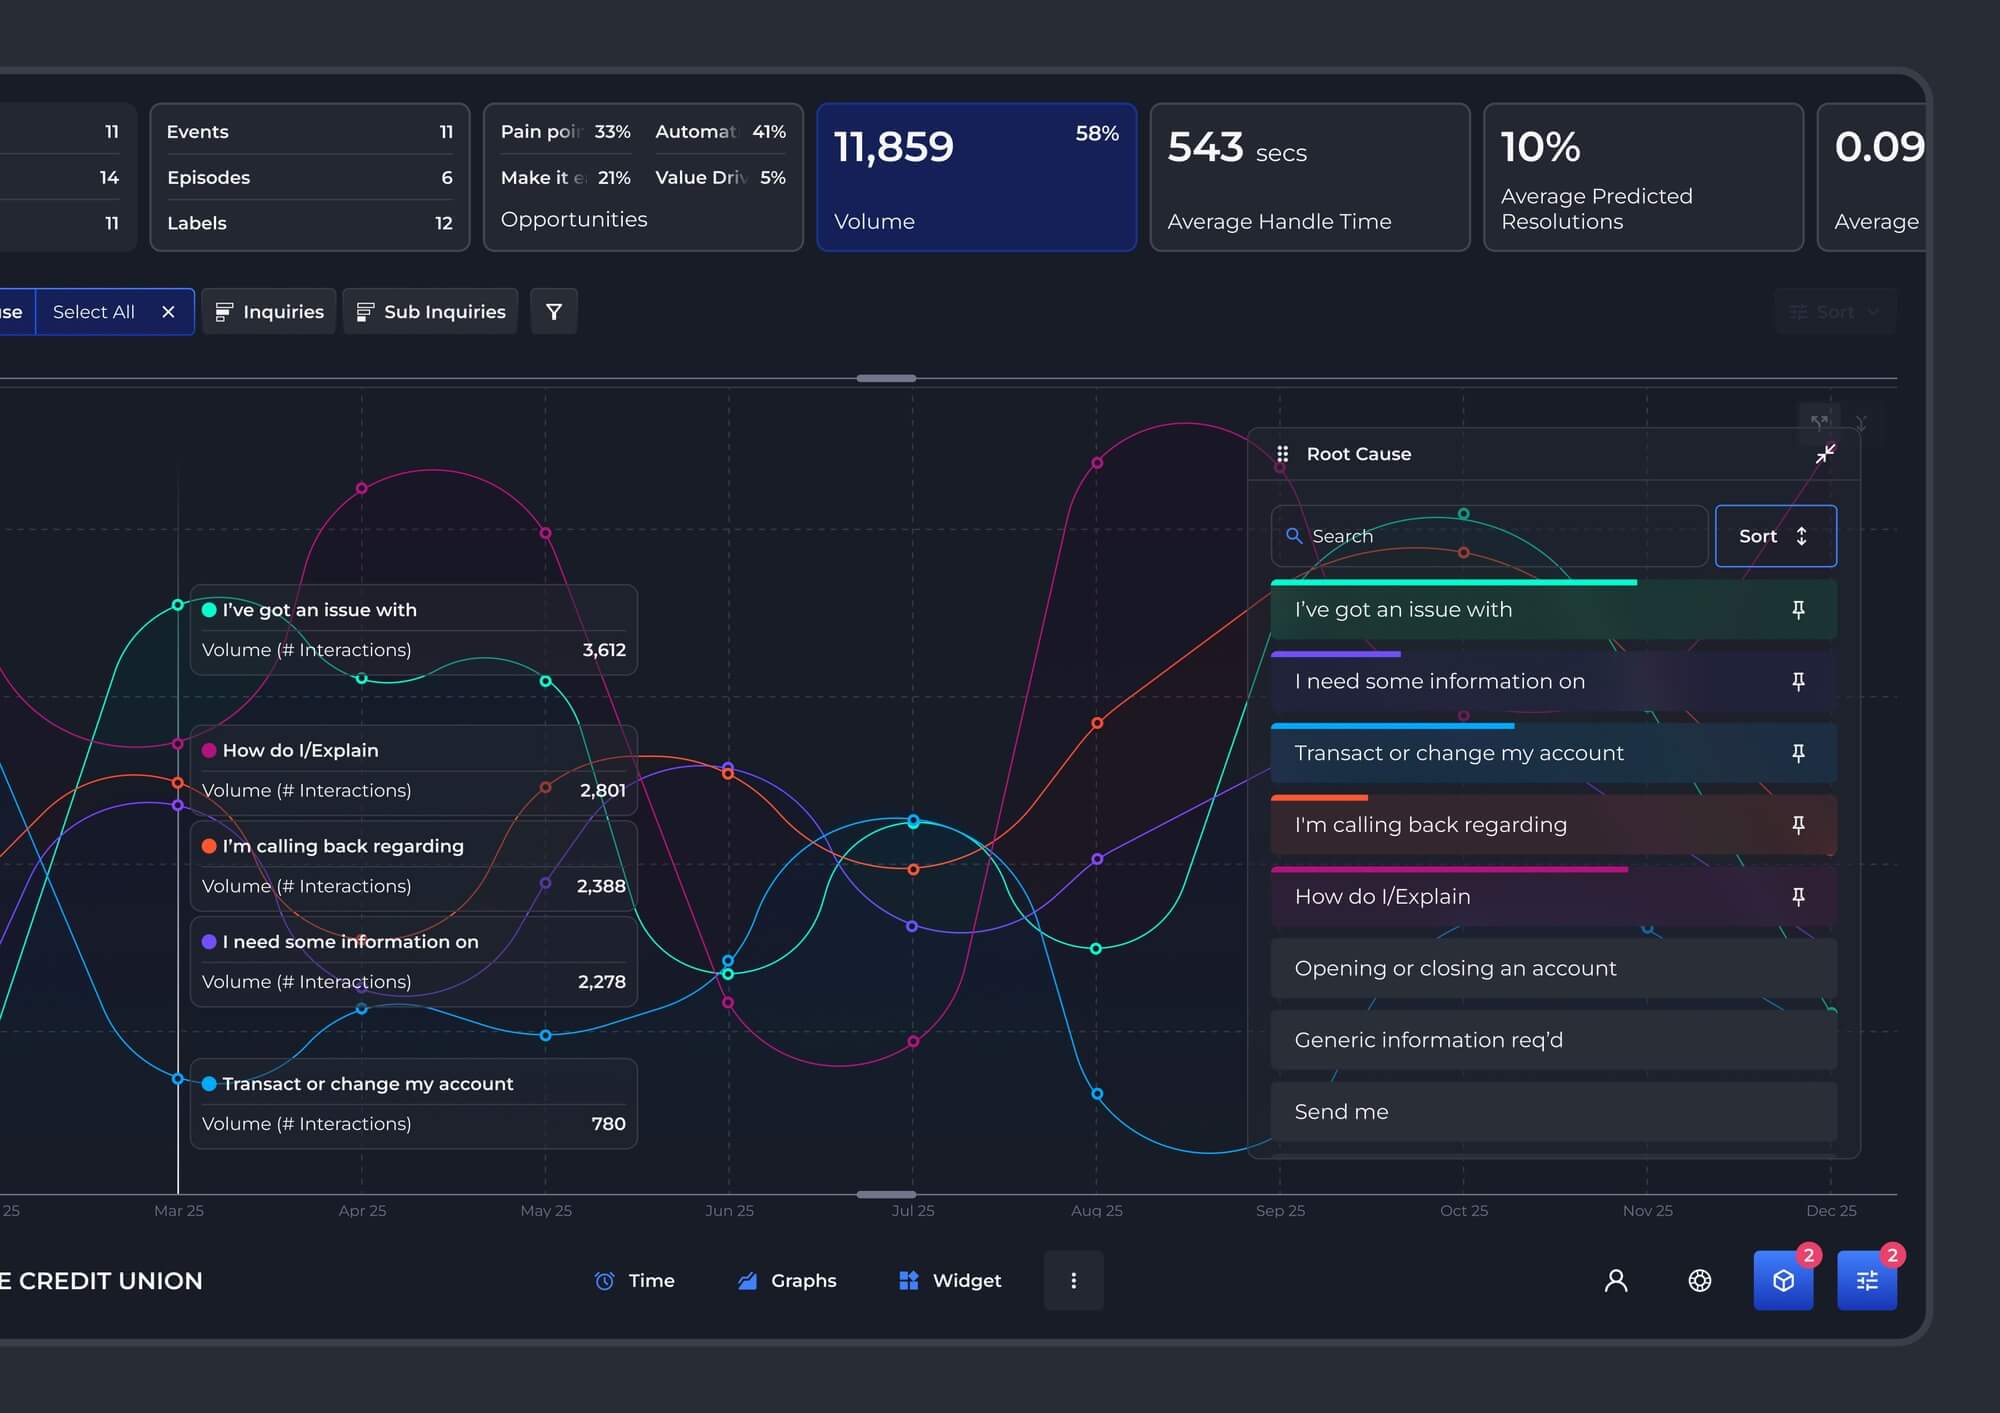
  • The upgrade centred on a single configurable interface, replacing a fragmented multi-screen experience with one live surface where users can access all key analytics simultaneously. Previously, insight required mentally joining the dots across separate charts; the redesign collapsed those gaps, so volume, metrics, time, and change could be understood in a single view. Any dimension responds instantly to direct manipulation, enabling users to test hypotheses and uncover cause-and-effect in seconds. Panels can be resized or hidden to suit different workflows, reducing cognitive load without sacrificing depth. The platform was also architected for future data scale and native generative capabilities.

  • OI has transformed how enterprise contact centres understand and act on customer demand. By making millions of conversations instantly searchable and actionable, the platform helps organisations uncover hidden operational inefficiencies, reduce avoidable contact, and improve customer experience at scale. Clients have recorded more than 20% reductions in inbound contacts and 25% improvements in operational efficiency within a year, while gaining visibility into pain points, self-service opportunities, and agent performance that were previously hidden in fragmented reporting. The platform now supports thousands of users across Australia and the US, serving major organisations including Suncorp, Bupa, Colonial First State, UniSuper, and BOQ.

  • Single live surface. Five pages and thirty graphs from the prior platform consolidated into one configurable view, where volume, metric, time, change, and relativity sit together so users see relationships, not just data points.Direct manipulation as the primary interaction. Users click or drag any dimension and the dataset responds live, making cause and effect visible in the act of exploration. No instructions, no setup, no analyst in between.Decision-first information architecture. Every screen is organised around an operational decision, not a dataset. The user starts with a question, not a chart.Animation as a semantic tool. Motion draws the eye to what's changing, so the most important signal is always the first thing seen.Advanced functionality, made beautiful. All the charting depth analysts expect from BI tools: zoom, resize, merge, absolute and relative change, and period overlap for direct comparison. Built natively into the interface. The functionality is table stakes. The design isn't.Native generative capability. Users can ask the data to explain itself, in plain language, inside the same interface.Token-based design system underneath. Semantic colour tokens, modular components, and typography built for data-dense screens, designed to scale with the dataset.